Blog

The Bible on Twitter in 2015

Here’s a quick look at the 40 million Bible verses shared on Twitter in 2015.

Through the Year

As with last year, in 2015 we see the prevalence of through-the-Bible-in-a-year plans that feature certain verses on particular days. Also note the cluster in Leviticus and Deuteronomy after the U.S. Supreme Court ruling on same-sex marriage.

This graph emphasizes that many people tweet Bible reading plans.

Most-Popular Verses

RankVerseTweetsText
1.Phil 4:13262,150I can do all things through him who strengthens me.
2.John 3:16206,480For God so loved the world, that he gave his only Son, that whoever believes in him should not perish but have eternal life.
3.Jer 29:11127,355For I know the plans I have for you, declares the LORD, plans for welfare and not for evil, to give you a future and a hope.
4.Rom 8:18115,719For I consider that the sufferings of this present time are not worth comparing with the glory that is to be revealed to us.
5.Rom 8:28115,588And we know that for those who love God all things work together for good, for those who are called according to his purpose.
6.Prov 3:5110,216Trust in the LORD with all your heart, and do not lean on your own understanding.
7.1Pet 5:798,974Casting all your anxieties on him, because he cares for you.
8.Rom 5:897,841But God shows his love for us in that while we were still sinners, Christ died for us.
9.2Tim 1:788,924For God gave us a spirit not of fear but of power and love and self-control.
10.Ps 56:386,998When I am afraid, I put my trust in you.

You can also download a text file (411 KB) with the complete list of verses and how many times they were tweeted in 2015.

Top Verse Sharers

Here are the top non-spam (as far as I can tell) accounts and how many Bible verse tweets they tweeted this year (including retweets):

  1. JohnPiper (109,589 tweets)
  2. Franklin_Graham (94,341 tweets)
  3. DangeRussWilson (83,176 tweets)
  4. JosephPrince (76,031 tweets)
  5. siwon407 (31,141 tweets)
  6. DaveRamsey (29,690 tweets)
  7. TimTebow (29,212 tweets)
  8. mainedcm (28,687 tweets)
  9. JoyceMeyer (25,381 tweets)
  10. BishopJakes (24,243 tweets)
  11. jamesmacdonald (23,753 tweets)
  12. camerondallas (22,499 tweets)
  13. JordanElizabeth (21,735 tweets)
  14. AllyBrooke (21,108 tweets)
  15. Kevinwoo91 (19,735 tweets)
  16. ToriKelly (19,716 tweets)
  17. ihopkc (16,920 tweets)
  18. revraycollins (16,211 tweets)
  19. InTouchMin (15,888 tweets)
  20. ToddAdkins (13,825 tweets)

Most-Retweeted Tweets

Here are the year’s most-retweeted tweets with Bible verses in them. Here you’ll find tweets from various pop stars, Vine personality Cameron Dallas, someone named Cory Machado (I’m unclear why he has a million followers), a fan account for boxer Manny Pacquiao (not the boxer himself), and Tim Tebow. I don’t understand Korean pop star’s Siwon Choi’s tweet at all.

Bible Spam

Around 20 million of the 40 million verses shared on Twitter this year, as far as I can tell, came from Bible spam accounts–accounts that do nothing but tweet Bible verses all day (hundreds of times a day in some cases). I removed the most-prolific accounts from the above data, but undoubtedly it still contains tweets from many Bible spammers.

Posted in Twitter

Trending thirty years of Bible translations on Google Scholar

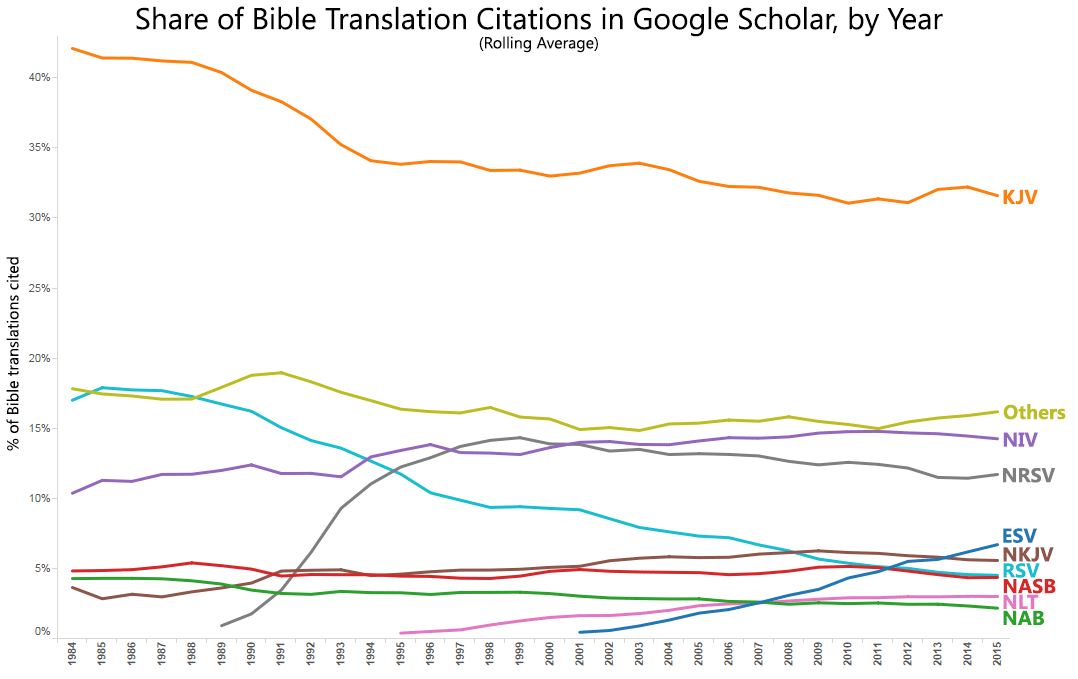
Google Scholar keeps track of book citations, including citations of the Bible, in academic works. By crafting careful queries, we can try to identify trends in Bible translation usage among scholars:

Share of Bible Translation Citations in Google Scholar, by Year

Discussion

First, the prevalence of the King James Version surprises me, since in general I’d expect biblical scholars to cite more modern translations in their work. However, it turns out that when scholars outside the field of biblical studies cite the Bible (generally for just a single quote), they’ll often use the KJV. Since Google Scholar doesn’t limit results to only religious scholarship, the KJV comes out on top.

Second, scholars prefer the NRSV and RSV more than the wider Christian audience does: the NRSV has held a roughly 12% share of scholarly citations since its introduction but is responsible for under 2% of Bible translation searches on Google. The RSV (and even the KJV) declined in scholarly share shortly after the release of the NRSV in 1989.

Third, the only translations to gain substantial scholarly share over the past thirty years are the NIV, the NRSV, and the ESV; the latter two are revisions of the RSV.

Methodology

I constructed a spreadsheet of thirty-two major English Bible translations and how many citations they had each year from 1984 to 2015. (My favorite article that I came across discusses “Voldemort Phrases” (PDF)–the generic “he,” as in, “He Who Must Not Be Named”–in Bible translations.)

This methodology has several major limitations; therefore, you shouldn’t read too much into the exact numbers but should instead focus on broader patterns. Overall, however, the percentages largely match my expectations.

The first limitation is that the queries are imperfect: “ESV,” for example, can serve as the abbreviation for any number of phrases (e.g., “end-systolic volume”). While I tried to pick queries that appeared to yield relatively few false positives, they’re definitely still there. I couldn’t combine queries (e.g., [niv bible or “new international version”]), so the absolute numbers shouldn’t be taken too literally.

Second, Google Scholar’s definition of “scholarly” work is fairly loose; some of the fluctuations in certain translations may be the result of Google changing its scope over time.

Third, a straight counting approach, as here, doesn’t necessarily best represent scholarly influence. However, I couldn’t do anything more sophisticated since Google temporarily prevented me from accessing Google Scholar a few times for collecting even this basic data by hand. (They felt that it looked like I was running automated queries.)

Inspired by Metacanon.

Posted in Bible, Translations

Visualizing historical English metaphors related to the Bible

The images that come to mind when you think of heaven aren’t the same ones you would’ve conjured had you lived a hundred, five hundred, a thousand, or two thousand years ago. The word heaven accretes and shifts meaning over time–the cosmology of the Israelites who first heard the creation story in Genesis, for example, uses the metaphor of a “firmament” to explain the structure of the heavens, while your idea of the physical heavens probably involves outer space and Pluto.

Or take angels. Before the Renaissance, you wouldn’t have pictured a cherub as a chubby baby, yet today the first image that comes to mind when you think of angels might very well be this:

Detail of Raphael's Sistine Madonna showing two child-looking cherubs. From Raphael’s Sistine Madonna, 1512

Linguists can pinpoint precisely when English speakers started to use cherub to refer to a child in this way: 1705. (The OED entry for cherub elaborates that this image developed further during the 1800s. Thank you, Victorians.)

Researchers from the University of Glasgow have created a website that explores how metaphors from different semantic domains (“angels” and “children,” for example) bleed into each other over time: Mapping Metaphor.

While the website lets you visualize the data in a number of ways, I thought it would be interesting to combine a couple of their visualizations to clarify (for myself) the historical cross-pollination of some Bible-related metaphors in English.

The first chart shows how metaphors have shifted over time for heaven and hell. The arrows indicate the direction of the metaphor. For example, an arrow points from height to heaven because linguistically we apply the real-world idea of height to the location of heaven: the metaphor points from the concrete to the abstract. Conversely, when the arrow goes the other direction, as from heaven to good, the metaphor points from the abstract to the concrete. When we say, “This tastes heavenly,” for example, we’re applying some qualities of heaven to whatever we’re eating.

Historical metaphors for heaven and hell.

The second chart explores the application of metaphors relating to angels and the devil. The Mapping Metaphor blog discusses this metaphorical angel/devil dichotomy in some detail.

Historical metaphors for angels and the devil.

There’s also data for Deity (i.e., God), but its historical connections overlap so much with other (mostly Greek) deities that it’s not so useful for my purpose here.

Finally, I want to mention that the source data for the Mapping Metaphor project, The Historical Thesaurus of English, is itself a fascinating resource. It arranges the whole of the English language throughout history into an ontology with the three root categories represented by color in the above images: the external world, the mental world, and the social world. Any hierarchical ontology raises the usual epistemological questions, but I think the approach is fascinating. The result is effectively a cultural ontology (at least to the extent that language encodes culture).

I compared a few Historical Thesaurus entries to the Lexham Cultural Ontology (designed for ancient literature) and found a surprising degree of correlation: all the entries I looked up in Lexham mapped to one or a combination of two entries in the Historical Thesaurus. Considering that we know (pdf, slide 33) that people who write linguistic notes in their Bibles are more interested in the meanings of English words than they are in the definitions of the original Hebrew and Greek words, I wonder whether an English-language-based ontology might prove a fruitful approach to indexing ancient literature–at least for English speakers.

Via PhD Mama.

Posted in Art, Linguistics, Visualizations

How the Internet responded to the Supreme Court same-sex marriage decision on Google, Twitter, and Bible Gateway

Evangelical leaders: “Outrage and panic off-limits.” Internet responds with outrage and panic.

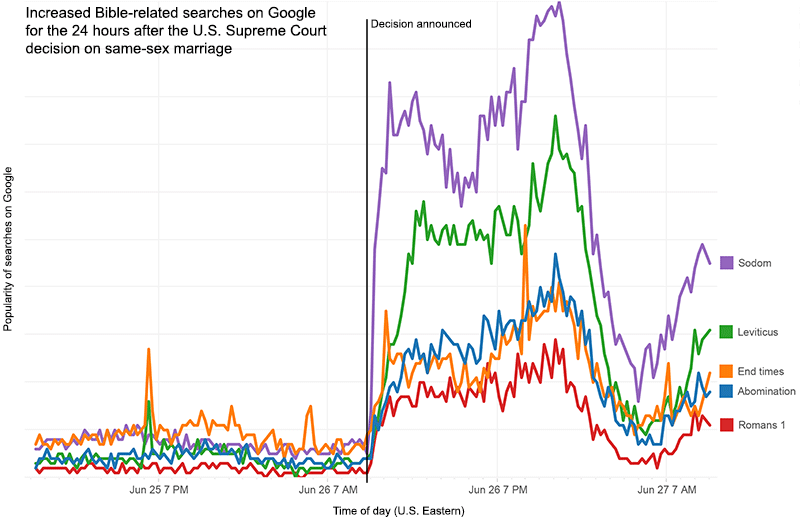
I was half-hoping that Christianity Today would use this Buzzfeedy title (referring to a previous article of theirs) for my piece there about the quantitative aftermath of Friday’s Supreme Court decision.

Here’s a teaser:

Surges in five keywords after the Supreme Court decision.

Separately, the same-sex-marriage topics I mentioned in my last post have received a surge of votes since the decision on Friday, and I’m pleased (from a statistical perspective) that the voting is consistent with previous patterns.

The below chart shows the cluster voting pattern since 10 AM EDT on June 26, 2015, when the decision was announced. The three clusters with the lowest number of overall votes didn’t receive any votes during this period: “Everything for its purpose,” “David and Jonathan,” and “Personal struggle against sin.”

Voting patterns from June 26 to 29: Sexual immorality received the most votes, followed closely by Law, then One flesh, Love your neighbor, Do not judge, Live morally, and Eunuchs and the childless.

Posted in Current Events, Topics

Quantifying how people cite the Bible in the same-sex marriage debate

A recent New York Times feature discusses how evangelicals interpret a few Bible passages in support of or against same-sex marriage. The pro-con format of the Times feature supplies anecdotes, but it doesn’t answer the question of how people are applying the Bible to the debate on a wider scale. For that, we have to turn to data.

This site has a topical Bible that allows people to vote on and suggest Bible verses they think are relevant to a particular topic. Since 2007, the topics of homosexuality, same-sex marriage, and gay marriage have received over 30,000 votes across 940,000 pageviews, providing a reasonably broad window into the passages that people–largely evangelical Christians–apply to the debate.

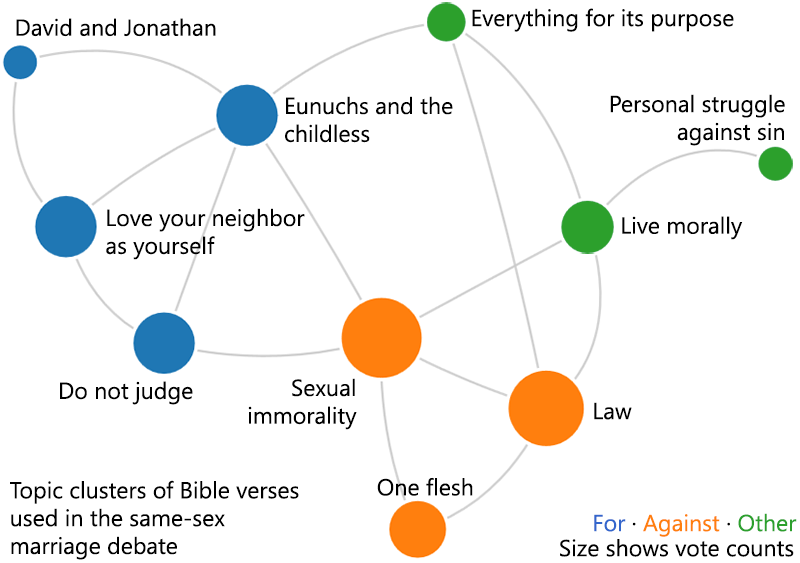
The statistical patterns of these 30,000 votes reveal sixty Bible passages that commonly enter the discussion, falling into ten thematic clusters:

Statistical connections among the ten clusters. This chart shows the strongest statistical connections among the ten clusters.

Three of these clusters are used against same-sex marriage: nineteen passages about sexual immorality (the largest cluster), four relating to the Old Testament Law, and three about man and woman becoming one flesh in marriage.

Four clusters are used to justify acceptance (or at least tolerance) of same-sex marriage: seven passages about loving your neighbor, five about David and Jonathan, four about not judging, and four about valuing eunuchs and the childless.

The final three clusters don’t deal directly with the topic: ten passages about living morally, two about how everything has a purpose, and two about Paul’s personal struggle with sin.

We can also examine how the popularity of each cluster has changed since 2011:

Topic changes over time. (This chart uses a logarithmic scale to better distinguish the lower vote counts; the top lines have much higher vote counts than the lower lines.)

This data is hardly scientific since it depends on visitors to a single website and doesn’t necessarily indicate culture-wide rhetorical shifts. With that caveat in mind, however, we can observe a few trends.

First, the three clusters with the most votes are all against same-sex marriage. The “one flesh” cluster gained speed in March 2013, when the U.S. Supreme Court heard arguments about California’s Proposition 8 and the federal Defense of Marriage Act.

Second, the three most-popular clusters in support of same-sex marriage started earning substantial numbers of new votes at the end of 2013, when Hawaii, Illinois, and New Mexico legalized same-sex marriage, and a judge ruled Utah’s ban unconstitutional. A Christianity Today article from the time indicates that at this point evangelicals started to recognize that same-sex marriage would probably become legal everywhere and began to change their rhetorical strategies. The above chart suggests a shift in tone at this time away from “do not judge” to “loving your neighbor” and applying to the debate passages about accepting eunuchs and the childless.

Third, the chart shows a more-recent (and still nascent) rhetorical shift to comparatively ambiguous positions. The general command to “live morally” can apply to both sides of the debate, for example.

These shifts are consistent with recent polls that suggest opposition to same-sex marriage is softening among evangelicals. Just looking at the topical Bible vote counts above, in October 2013, 95% of votes were for passages used against same-sex marriage; by May 2015, this percentage had fallen to 72%.

These trends suggest to me that many people who use Bible verses in the debate are adapting to a shifting rhetorical landscape. They’re attempting to discern how the Bible can remain relevant to the conversation and are in turn changing the mix of passages they cite.

Posted in Current Events, Topics

A Sixteenth-Century Bible Study Flowchart

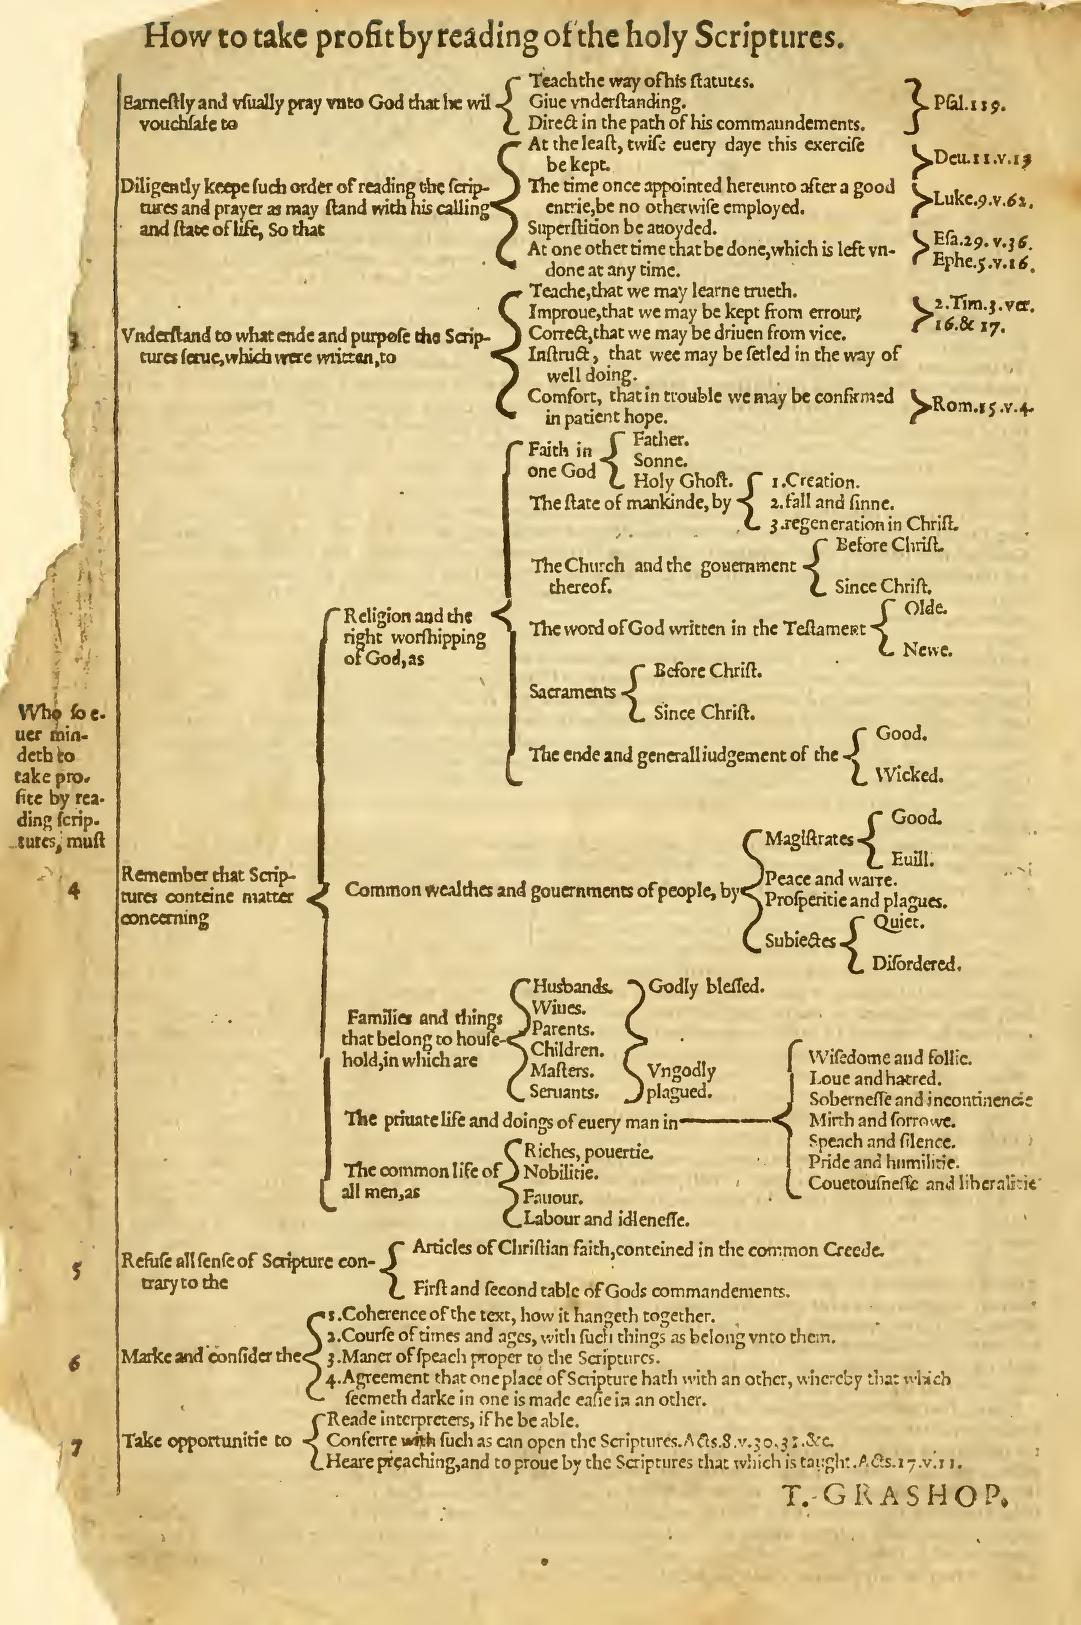
Many printings of the Geneva Bible after 1579 contain the following flowchart by T. Grashop. This flowchart reflects the Renaissance obsession with ordering the world using tree diagrams and presents a systematic approach to studying the Bible. I share it here to show that “mind-mapping” Bible study isn’t a new idea; it has extensive historical roots.

Scan of the Grashop page from the Geneva Bible. Credit: archive.org

Below is a reproduction I created with modernized spelling and design. I particularly want to note the reference to Isaiah 29:36 in this chart. This verse doesn’t exist. If anyone knows what verse Grashop might have meant, especially as it relates to “Superstition be avoided” when studying the Bible, I’d be interested in correcting this 400-year-old typo. Sean Boisen in the comments presents a plausible case that it should be Isaiah 2:6.

Revised version of Grashop's flowchart.

Also available in PDF: 8.5x11 inches or 8.5x14 inches (full size).

I consider all these Grashop-related files to be in the public domain; if you want to reuse them, you don’t need to credit anyone.

Posted in History, Visualizations

Heralds of the Emojipocalypse

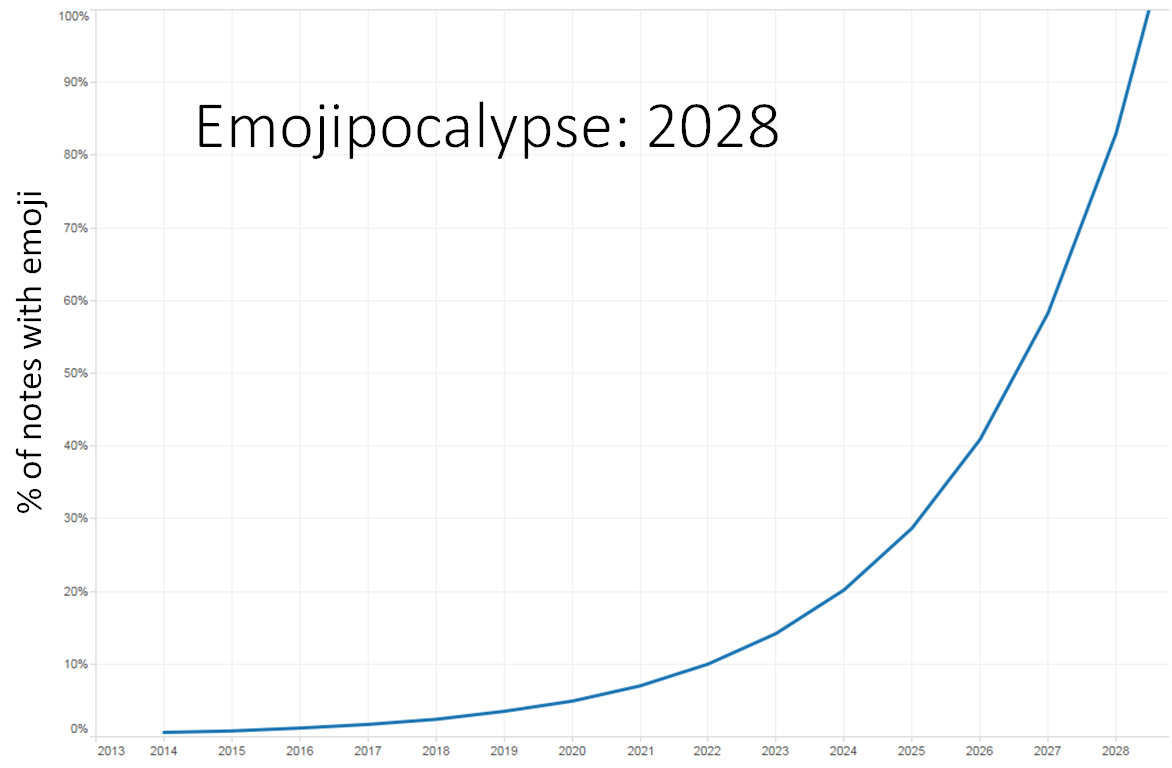
The final slide of my presentation (.pptx, .pdf) at last weekend’s BibleTech conference half-jokingly argued that 100% of digital Bible notes would contain emoji by the year 2028, up from 1-2% in 2015:

An exponential curve extends from 1% in 2015 to 100% in 2028.

Unknown to me, the previous day, Instagram had published an analysis showing how 40% of Instagram posts contained emoji in April 2015. Already they’re well on their way to over 50% of all posts including emoji–some countries (Finland, France) are already there, which in turn means that the emojipocalypse may arrive sooner than expected.

Instagram’s analysis ascribes consistent meanings to certain emoji. For example, they provide several religion-related meanings for the so-called* “praise the Lord” emoji:

🙌: ... #yeslawd, ... #stayblessed, ... thou

“Thou” in particular suggests that people are sharing KJV-based Bible verse pictures with this emoji attached to them.

The Instagram study, with its high emoji percentages, indicates to me that people use emoji when they’re already primed for images and especially when they’re sharing a photo. This explanation makes a lot of sense to me, and I feel silly for not thinking of it earlier, especially considering that a whole section of my talk discusses how people approach the Bible differently when images are involved. Let’s look at the data:

Percent of Tweets with Emoji

Bible verses shared on TwitterLinks to Bible websites on Twitter
All tweetsExcluding retweetsAll tweetsExcluding retweets
With image14.7%13.3%24.8%6.2%
Without image2.4%3.0%2.7%2.4%

There are two datasets here: one tracks all the Bible verses shared on Twitter (for one day only: about 200,000 tweets), and the other tracks links to Bible websites on Twitter (for all of April 2015: about two million tweets). In both datasets we see that people are far more likely to include emoji when their tweet includes an image than when it doesn’t.

So there you go: emoji usage correlates with image usage, at least on Twitter and at least with Bible verses.

Separately, the Bible-verse Twitter tracker now keeps a daily total of emoji shared with Bible verses.

  • No one actually calls it this.

Posted in Emoji, Twitter

What Twitterers Are Giving up for Lent (2015 Edition)

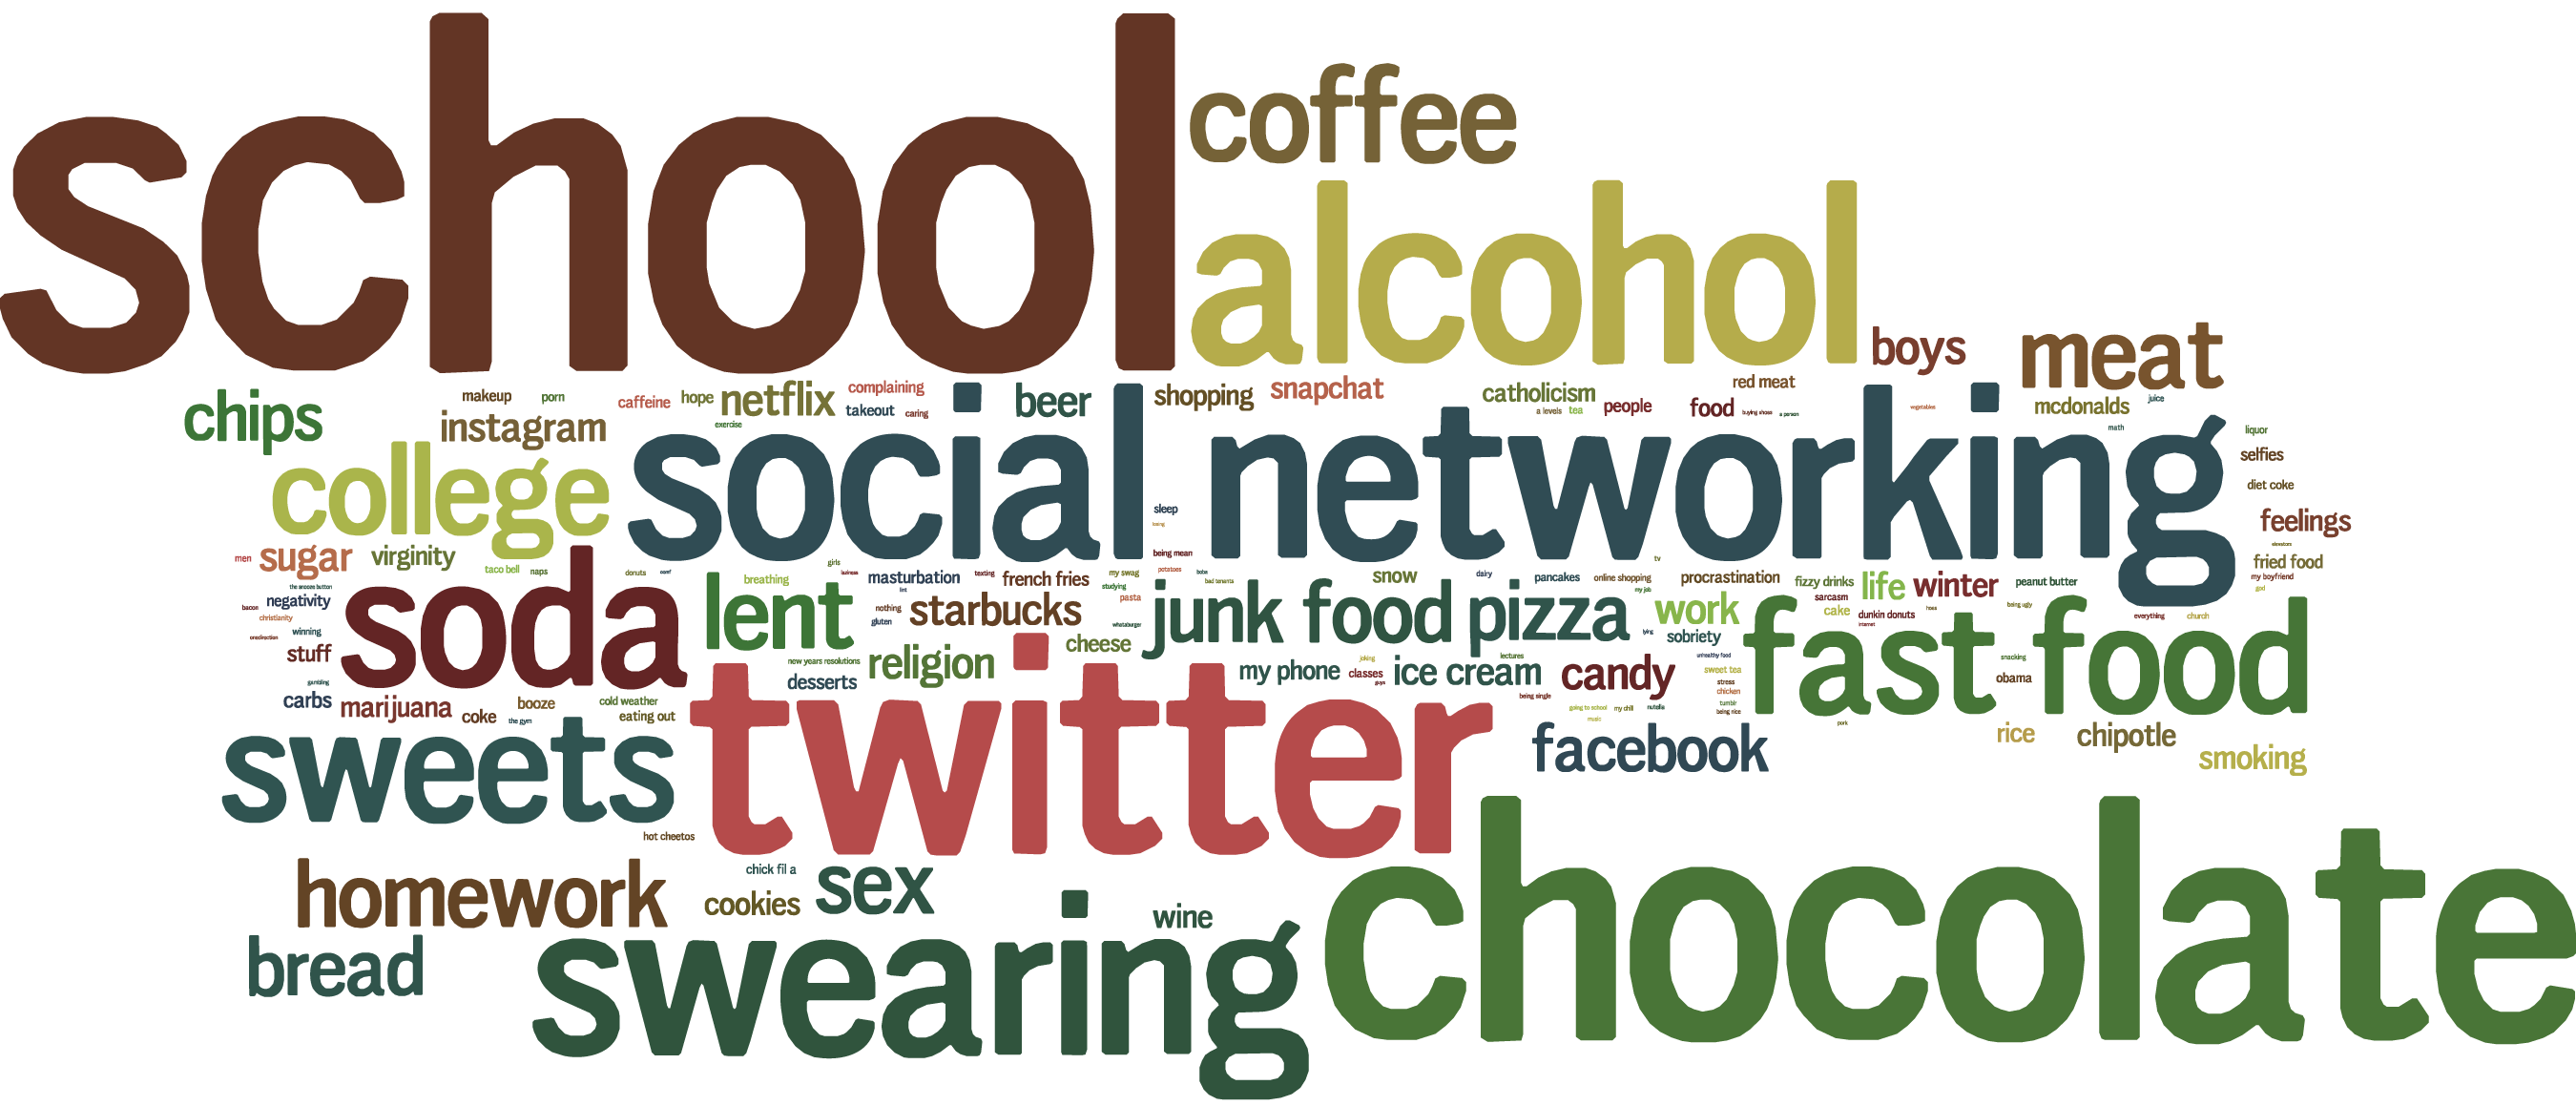
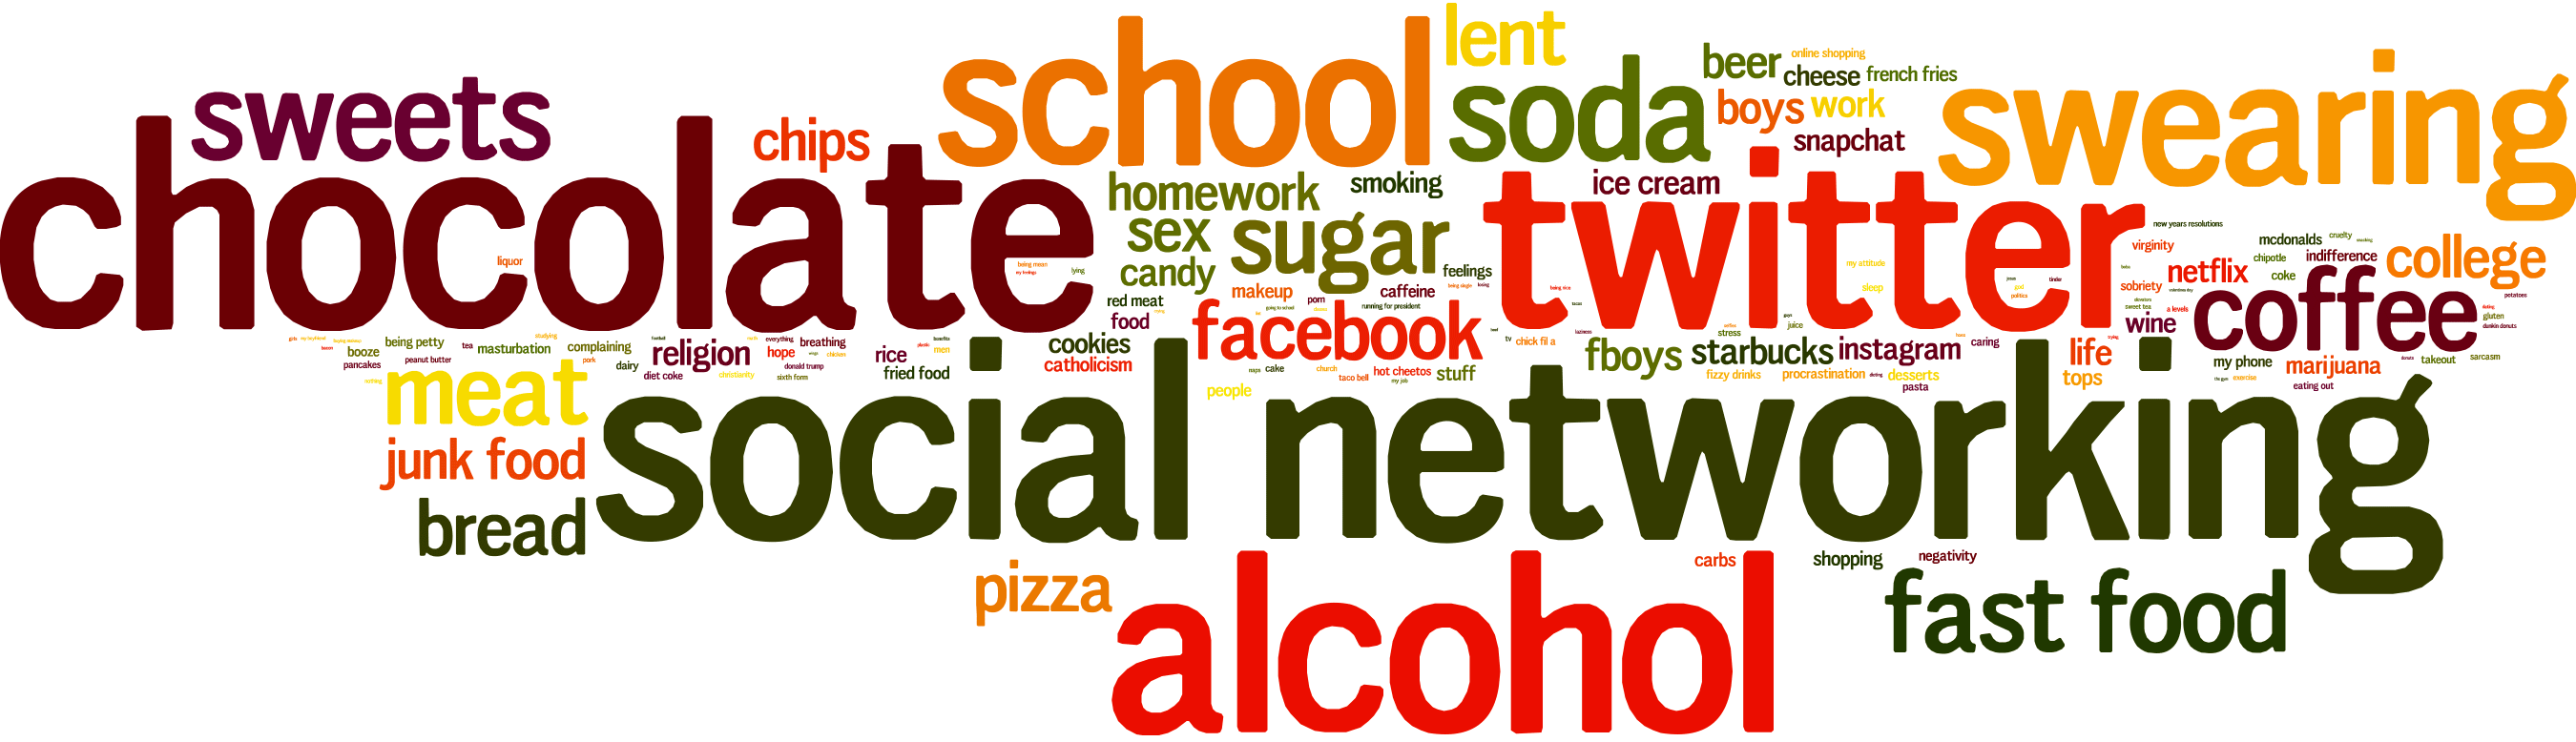
The top 100 things that people on Twitter are giving up for Lent in 2015.

“School” once again tops the list of things Twitterers are giving up for Lent, with over 5% of tweets mentioning it. This year’s list is quite stable compared to last year’s, especially in the top ten.

My hypothesis last year was that “school” was so high because Ash Wednesday coincided with spring break at many schools, but that isn’t the case this year. In the UK, A-Level exams are coming up at the beginning of March, so that may be part of it.

Another surprise for me this year, given the cold weather gripping the northeastern United States, is that weather-related tweets aren’t more popular; as a category, they move up one place from last year (to #12 from #13), though individually “snow” moves up eight places and “cold weather” moves up 79 places.

Hot Cheetos continue their run, making the top 100 for the first time.

The biggest surprise to me is #12, f***boys. I wasn’t familiar with this term before, and I’m still not totally sure what it means. Knowyourmeme.com says that it’s “used as a pejorative toward men who are perceived as oversexed or disrespectful toward women,” while also serving as a meme involving skeletons on Tumblr. It’s easily the biggest gainer this year.

This list draws from 409,000 tweets during February 14 to 21 that mention giving up something for Lent and, except as noted, excludes retweets.

RankWordCountChange from last year’s rank
1.School6,2810
2.Chocolate4,2930
3.Twitter3,8760
4.Alcohol3,216+1
5.Social networking3,090+2
6.Swearing2,887-2
7.Soda2,473-1
8.Sweets2,1220
9.Fast food2,0560
10.Coffee1,706+4
11.College1,631+27
12.F***boys1,527 
13.You1,462+5
14.Lent1,348-4
15.Meat1,335-4
16.Homework1,208-4
17.Sex1,165-2
18.Junk food1,112-5
19.Pizza1,067+1
20.Bread1,060-3
21.Chips905-5
22.Facebook853-3
23.Boys665+6
24.Candy625-2
25.Netflix610+12
26.Religion602-2
27.Beer596+5
28.Starbucks591-7
29.Work575-2
30.Sugar565+15
31.Instagram554-8
32.Ice cream520-4
33.Life4890
34.Winter454+2
35.Smoking441-4
36.Wine435+13
37.Me434+10
38.Cookies430-12
39.Chipotle422+4
40.Snapchat408+16
41.Feelings393+27
42.Marijuana381-12
43.Shopping374-3
44.Rice357+10
45.My phone351-6
45.Virginity351-21
46.Catholicism337+9
47.Food329-13
48.Cheese315-2
49.Stuff307-8
50.McDonald's300-15
51.Carbs295-1
52.Snow284+8
53.Desserts276+8
54.French fries257+9
55.People248+4
56.Coke245+1
57.Fried food242-5
58.Red meat237+14
59.Masturbation233-15
60.Selfies230-18
61.Hope224+23
61.Sobriety224-14
62.Procrastination219-4
63.Complaining216+14
64.Makeup214+2
64.Caffeine214-12
65.Booze211+17
65.Negativity211+5
66.Takeout210-2
67.Eating out184+22
68.Cake183+17
69.Chick Fil A179+31
70.Obama178-5
71.Fizzy drinks175-9
72.Porn173-4
73.Diet Coke1720
74.Pancakes159+5
75.Breathing1580
76.Classes157+55
77.Sleep156+6
78.Peanut butter152+2
79.Cold weather151+79
80.Hot Cheetos145+25
81.Liquor144+13
82.Tea143-4
83.Dunkin Donuts138+27
84.Taco Bell137-17
85.Men135+21
86.Sarcasm133-12
87.Winning127+32
88.Online shopping126+19
89.Sweet tea125-8
90.Caring124-14
91.Pasta123-5
92.Naps122+23
93.Juice117+5
94.Nothing115-25
94.A levels115+37
94.Being mean115+4
95.Him113+22
96.New Year's resolutions112+34
97.My swag111-27
97.Gluten111+4
98.Exercise110-8
98.Church110-4
99.My boyfriend109+2
100.Dairy106+26

Including Retweets

If we include retweets, here are the top ten things given up this year. It’s somewhat different:

RankWordCountDifference from non-retweet rank
1.School38,5320
2.College17,615+9
3.F***boys6,461+9
4.Chocolate5,127-2
5.Twitter5,074-2
6.Alcohol4,427-2
7.Social networking3,968-2
8.Swearing3,534-2
9.Obama3,351+61
10.You2,940+3
11.Soda2,820-4
12.Coffee2,506-2
13.Sweets2,499-5
14.Homework2,456+2
15.Fast food2,356-6

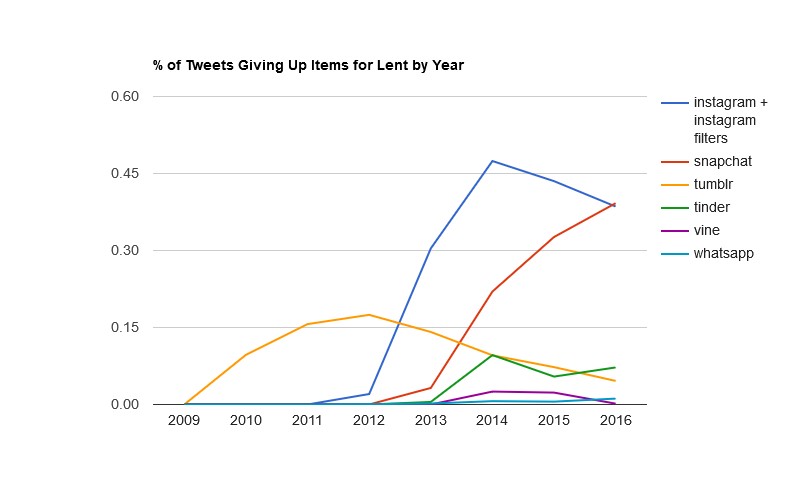
Second-Wave Social Media

Has Instagram peaked?

Instagram, Snapchat, Tumblr, Tinder, Vine, WhatsApp.

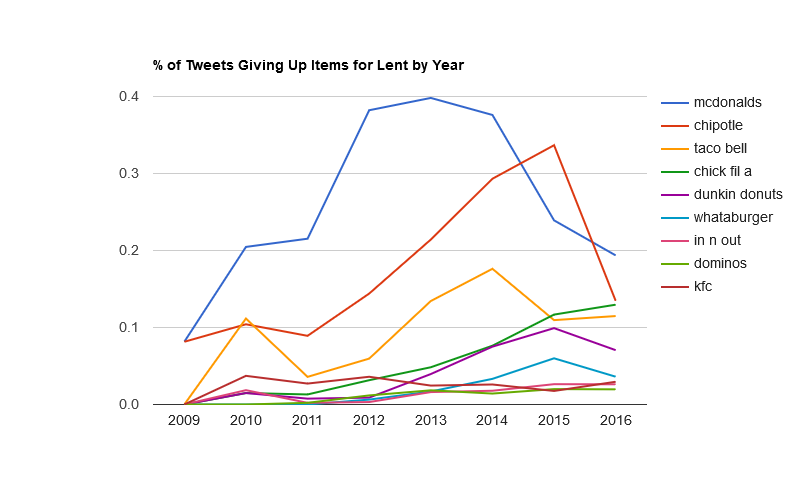
Fast Food

Chipotle passes McDonald’s this year. Chick Fil A passes Taco Bell, and Whataburger continues its rise.

McDonald's, Chiptole, Taco Bell, Chick Fil A, Dunkin Donuts, Whataburger, In N Out, Domino's, and KFC.

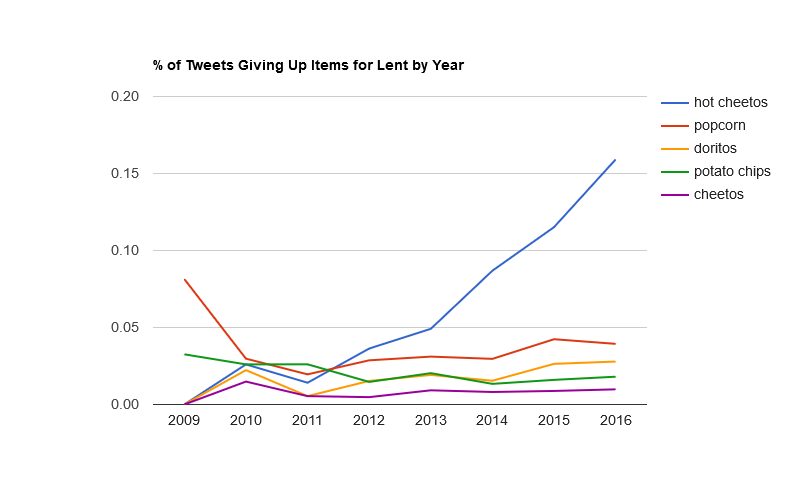
Snack Foods

Hot Cheetos are still on the move.

Hot Cheetos, popcorn, Doritos, potato chips, Cheetos

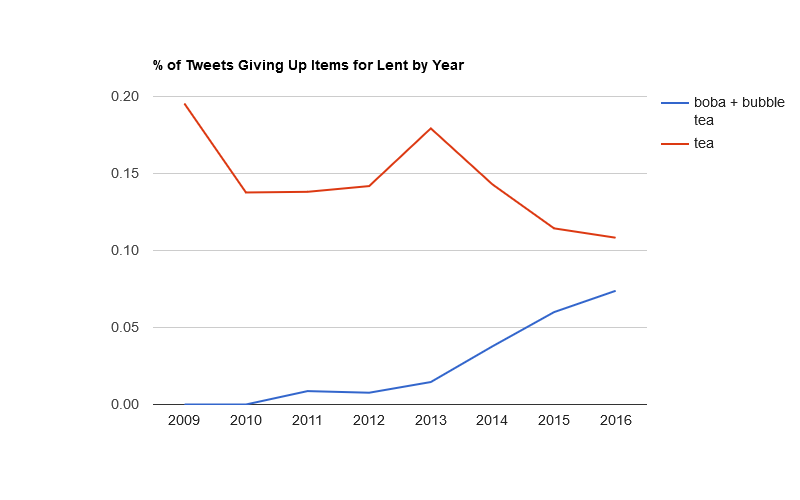
TV vs. Netflix

As TV declines, Netflix rises.

TV, Netflix

Categories

RankCategoryNumber of Tweets
1.food30,148
2.school/work10,819
3.technology9,277
4.habits8,057
5.smoking/drugs/alcohol6,230
6.relationship4,229
7.irony2,978
8.sex2,274
9.health/hygiene1,601
10.religion1,470
11.entertainment1,069
12.weather986
13.generic834
14.shopping685
15.sports410
16.money276
17.politics216
18.clothes174
19.celebrity165
20.possessions83

Media Coverage

The Lent Tracker received some media attention this year. In roughly chronological order:

  1. What is Lent and when does it start? (Bath Chronicle)
  2. Will millions of Christians give up Facebook and Twitter for Lent? (MarketWatch)
  3. Top things Twitter users are 'giving up' for Lent (AZ Central. It even has a video.)
  4. Chocolate or Facebook - what will you be giving up this Ash Wednesday for Lent? (Irish Central)
  5. 7 Ideas to Give Up For Lent (or just because) (North DelaWHERE Happening)
  6. Top 10 Things People Will Be Giving Up For Lent, According to Twitter (97.3 The Dawg)
  7. What To Give Up for Lent? Twitter Reveals Top 100 Ideas of 2015 (Christianity Today)
  8. Here’s What People On Twitter Say They’re Giving Up For Lent (Time)
  9. What do Twitter users say they're giving up for Lent? (KWWL)
  10. The Alpha and Omega of Lent: 5 FAQs on Ash Wednesday (AL.com)
  11. Chocolate, smoking, fast food: What are you giving up for Lent? (New Orleans Times-Picayune)
  12. Here’s What People on Twitter Say They’re Giving Up For Lent (Ryot News + Action)
  13. When is Lent 2015 and what should I give up? (Lincolnshire Echo)
  14. What people are giving up for Lent, as told to Twitter (Washington Post. I actually spoke to this reporter.)
  15. School and chocolate top list of what Twitter users are giving up for Lent (Kansas City Star)

Posted in Lent, Twitter

Track in Real Time What People Are Giving Up for Lent in 2015

See the top 100 things people are giving up in 2015 for Lent on Twitter, continually updated until February 21, 2015. You can also use the Historical Lent Tracker to see trends since 2009, though 2015 is still in flux, so I wouldn’t draw any conclusions (except maybe relating to Hot Cheetos–I seriously don’t understand that one) until the end of the week.

As I write this post, with about 4,000 tweets analyzed, perennial favorites “alcohol,” “chocolate,” and “social networking” lead the list. Given winter weather conditions in the eastern U.S., I expect that snow- and winter-related tweets will be popular this year.

Look for the usual post-mortem on February 21, 2015.

Posted in Lent, Twitter

Your Next Bible Will Be a Hologram

Or, how Microsoft may have just invented the future of intensive Bible study.

Microsoft this week unveiled HoloLens, an augmented-reality headset that overlays text and images on the real world and, in particular, anchors them to precise locations in space, as if they were real objects. Here’s one of Microsoft’s promotional shots to give you an idea of what wearing HoloLens is like:

A man is wearing HoloLens in his kitchen.

In this image, the man is apparently so obsessed with going to Maui that he maintains a Sims-like vacation paradise on his counter. The TV, “Recipes” button, Maui simulation, and to-do list are all virtual—using the device on his head, only he can see whether his Sims manage find a staircase to the beach or if instead they simply leap the fifteen feet off the cliff to the sand.

At this year’s BibleTech conference, I’m going to discuss why the idea of the “digital library” doesn’t appeal to certain kinds of people, and one aspect of the discussion involves the tension between print books and digital ones, each of which has advantages and disadvantages. Microsoft’s holographic technology (I recognize that one, they’re not really holograms, and two, what I’m describing here may go beyond what’s possible in the first devices) presents an intriguing way to bridge the physical and digital worlds of Bible study.

Certain kinds of people prefer to study from print Bibles, and for them digital resources serve as study augmentations: parallel Bibles and commentaries feature prominently in this kind of study practice. The melding of physical and digital has always been awkward for this type of person, although tablet computers have eased this awkwardness somewhat. Still, the main limitation of digital resources for this person is space; small screens (compared to the size of a desk) don’t provide enough room to look at very many resources simultaneously, forcing them to toggle between resources. Edward Tufte calls this phenomenon being “stacked in time” rather than “adjacent in space,” saying that the latter is generally preferable.

Holograms remove this space limitation by expanding your working area to your entire physical desktop:

An open Bible appears in the middle of a desk with holographic text around it.

In this image, only the physical Bible and the desk are actually there. The rest of the text appears to float on top of the desk, providing enough room to engage in the kind of deep study that you might crave. Here I imagine that you, wearing holographic goggles, have tapped Psalm 27:1 in your print Bible. The goggles recognize the gesture, draw a box around the text in your Bible, and provide all sorts of supplementary material in which you’ve previously expressed interest: photos for some sort of illustration, various commentary and exegetical helps, and cross-references. The digital resources displayed on the desk are interactive, letting you tap and scroll much as you would on a tablet computer. It’s a tablet without a tablet.

Of course, if you have a whole lot of material, there’s no need to limit supplementary material to a desktop; the whole room is available to you:

Holographic text appears on the walls of a room.

This image limits content to walls, but Microsoft’s HoloLens demo shows that the content could just as easily exist as three-dimensional objects in the middle of the room. And while I focus on low-density information displays here, there could easily be hundreds of information cards. Do you want to conduct a keyword search with hundreds of results? You can see all of them at once, all around you, rather than paging through them a few at a time.

Further, holograms give you the opportunity to merge print and digital resources in new ways. Suppose you’re studying Psalm 27:1, as above, and vaguely remember something you read once in one of your books. If you look over at your bookshelves, you might see something like this:

Bookshelves appear behind holographic text showing search results from three books on the shelves.

Here the holographic goggles have identified relevant books for you and show you where they are on your bookshelves, in addition to providing relevant excerpts for you to peruse. (The goggles know the page numbers either because you own the same volume digitally or because you originally read the book with your goggles on, and the goggles remember everything you read, even if you don’t; it’s like a super-Evernote.) The goggles surface passages related to the verse you’re reading and even remember passages you’ve highlighted (the yellow lines in the image). You can interact further with the holograms, looking through more search results, perhaps, or you can pull one of the books off the shelf and physically peruse it.

Finally, and most obviously, holograms push the 3D models, timelines, and maps that are now study-Bible staples into new dimensions of interactivity. They can literally pop off the page and expand into space, letting you manipulate them in ways that are impossible in the 2D space of a screen.

Holographic technology neatly sidesteps several limitations of current digital Bible study and could potentially usher widespread, transformative, digitally assisted Bible study. Or they may be just too geeky-looking. We’ll have to see.

Photo credits: endyk, Hc_07, 4thglryofgod, worshipbackgrounds, listentothemountains, coloneljohnbritt, 4thglryofgod, titobalangue, quoteseverlasting, steven_jamesP, nlcwood, netzanette, and williamhook on Flickr. The terrible Photoshopping is all my fault, not theirs.

Posted in Technology, Virtual Reality